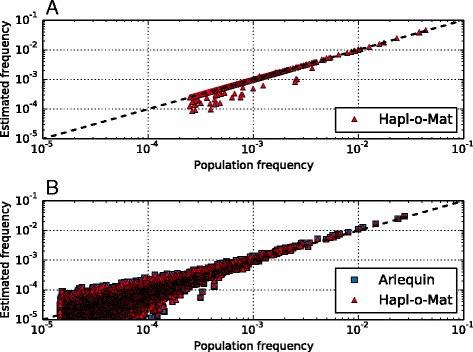
Fig. 2.

Haplotype frequencies from artificial population data. Plot a shows haplotype frequencies estimated via Hapl-o-Mat compared to original population frequencies from the first population model including genotyping ambiguities. Only one of ten runs is illustrated. Plot b shows a comparison between original population haplotype frequencies and frequencies estimated via Arlequin and Hapl-o-Mat on basis of the second population model. Due to the logarithmic scales, both plots neither show additional nor missing haplotypes
