
Fig. 3.
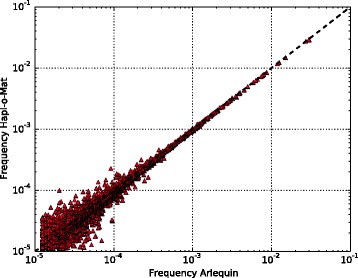
Comparison of haplotype frequencies estimated via Arlequin and Hapl-o-Mat from one sample of real population data. Due to the logarithmic scales, the plot neither shows additional nor missing haplotypes
Official websites use .gov
A
.gov website belongs to an official
government organization in the United States.
Secure .gov websites use HTTPS
A lock (
) or https:// means you've safely
connected to the .gov website. Share sensitive
information only on official, secure websites.
Comparison of haplotype frequencies estimated via Arlequin and Hapl-o-Mat from one sample of real population data. Due to the logarithmic scales, the plot neither shows additional nor missing haplotypes