Fig. 2.

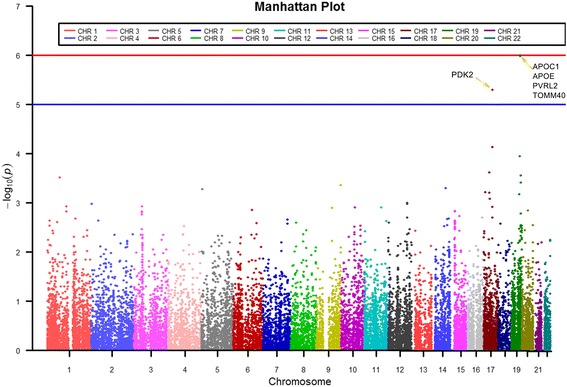
a Manhattan plot showing the gene-level p values in ADNI t-tau/Aβ1–42 ratio GWAS study. The blue line corresponds to p = 10−5; the red line corresponds to p = 10−6. Bonferroni-corrected threshold is p < 2.25 × 10⁻⁶ (i.e., 0.05/22,179)

a Manhattan plot showing the gene-level p values in ADNI t-tau/Aβ1–42 ratio GWAS study. The blue line corresponds to p = 10−5; the red line corresponds to p = 10−6. Bonferroni-corrected threshold is p < 2.25 × 10⁻⁶ (i.e., 0.05/22,179)