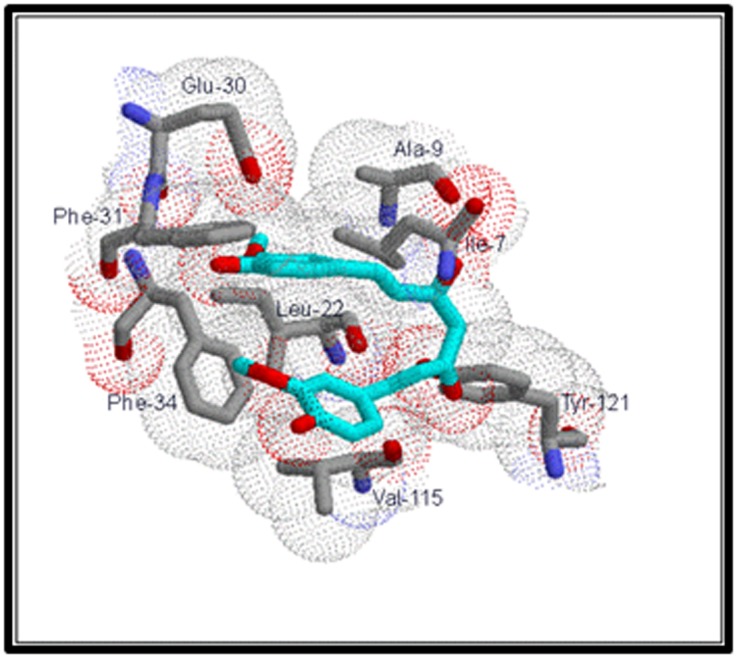
Figure 2.

VDW interactions of CUR with active site residues of DHFRA. Active site residues are numbered as per the original PDB file, 1DRE. VDW radii are shown as dotted spheres. Active site residues are shown in CPK color scheme. CUR is shown in cyan (with all its oxygens in red).
