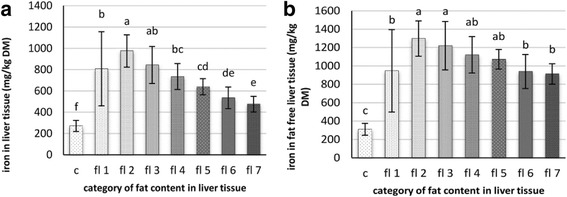
Fig. 2.

Mean levels of iron in the liver tissue (a) and iron in the fat free liver tissue (b) as a function of group membership (control [c, n = 16] or case [fl1–fl7, n = 85]) or the sum of fatty acids content in the liver (fl 1: ≤200 g/kg DM, n = 8; fl 2: >200–250 g/kg DM, n = 10; fl 3: >250–300 g/kg DM, n = 13; fl 4: > 300–350 g/kg DM, n = 10; fl 5: > 350–400 g/kg DM, n = 17; fl 6:> 400–450 g/kg DM, n = 12; fl 7:> 450 g/kg DM, n = 9); p < 0.05
