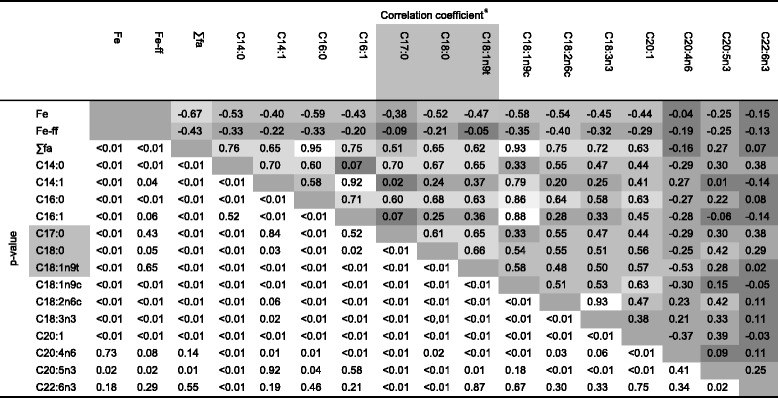
Table 5.
Crosstab regarding intercorrelations between iron content, total fatty acids and individual fatty acids in the liver tissue of deceased animals

aPearson correlation coefficients – for combination of fatty acids between grey boxes; Spearman correlation coefficients – combination of colourless boxes); correlations: 00-.19 “very weak”; .20-.39 “weak”; .40-.59 “moderate”; .60-.79 “strong”; .80-1.0 “very strong”
