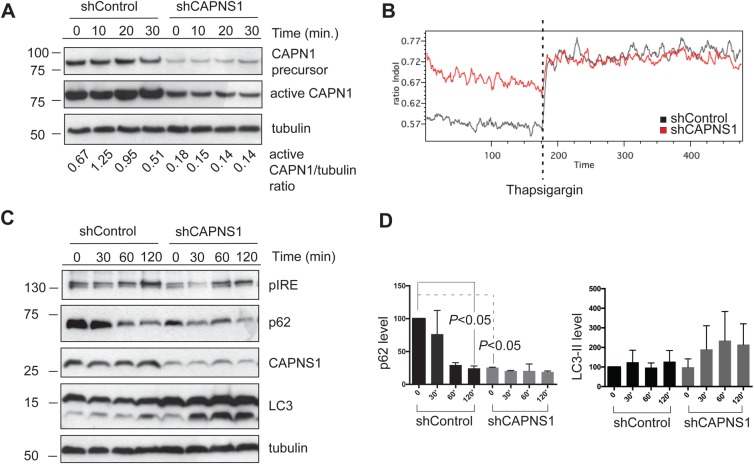
Fig. 1.
Thapsigargin treatment induces calpain activation and autophagy. (A) Control and shCAPNS1 cells were treated with 100 nM thapsigargin for 10, 20 and 30 min and the lysates subjected to western blot analysis to quantify the precursor and active form of CAPN1. The ratio between active CAPN1 and tubulin is reported below each lane. (B) Time course measurement of intracellular calcium concentration. The plot indicates the ratio of mean Indo Violet/Indo Blue emission values of each cell population at individual time points (minutes). The ratio corresponds to the relative calcium concentration of control and shCAPNS1 U2OS cells before and after addition of thapsigargin (100 nm final). Moving average was used as smoothing method. (C) shCAPNS1 cells were treated with 100 nM thapsigargin for 30, 60 and 120 min and the lysates subjected to western blot analysis to detect LC3, p62, pIRE, CAPNS1 and tubulin. (D) Levels of p62 and LC3 normalized to tubulin levels.

