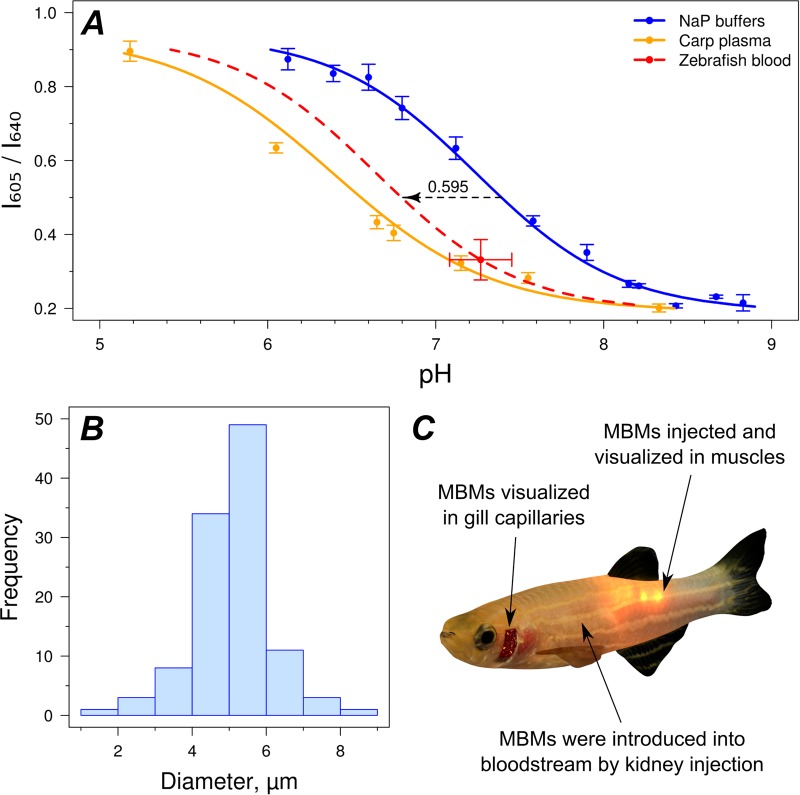
Fig. 1.
Calibration of fluorescent microencapsulated biomarkers (MBMs), and visualisation of MBMs in fish for in vivo pH measurements. (A) Calibration curves of the prepared pH-sensitive MBMs in sodium phosphate buffers, in C. carpio plasma, and in zebrafish blood. Putative calibration curve for MBMs in zebrafish blood was obtained by shifting the curve for buffers to fit the measurement in extracted zebrafish blood. For all measurements, the mean±s.d. is depicted. (B) Size distribution of prepared MBMs. (C) Scheme of zebrafish showing specific places where pH was measured with fluorescent MBMs.

