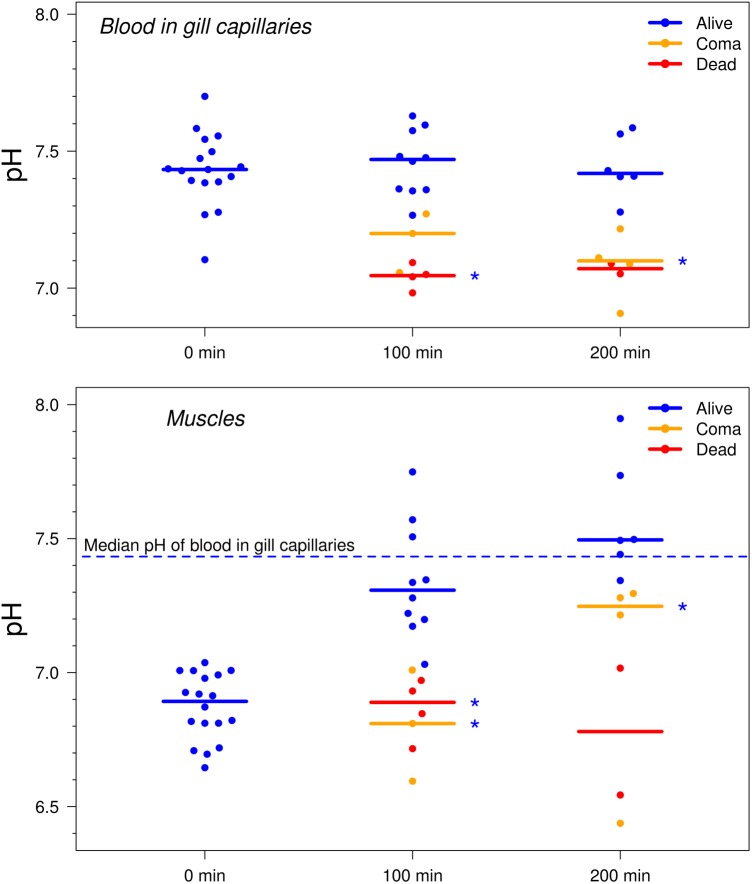
Fig. 2.
pH measurements in gill capillaries and interstitial fluid of muscles of fishes immediately after the injection of MBMs and at 100 and 200 min after the injections. Experiments were replicated three times; n=17 individuals; dead animals were excluded from the experiment after one measurement. Solid lines represent the median values. Dashed blue line shows the median pH of blood in gill capillaries of fish at normal state for all time points. *Indicates statistically significant difference from group of fish at normal state at the respective time point with P<0.05 (Dunn's test with Hommel's correction).

