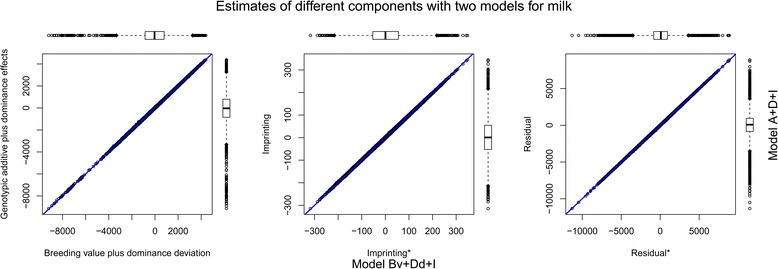
Fig. 1.

Individual estimates of variance components with two decomposition models for milk. Each point indicates the component estimate for each individual. Blue line indicates y = x. The x-axis shows the components from the model decomposing genetic effect to breeding value, dominance deviation and genotypic imprinting value, while y-axis shows the components from the model decomposing genetic effect to genotypic additive, dominance and imprinting values
