FIGURE 1.
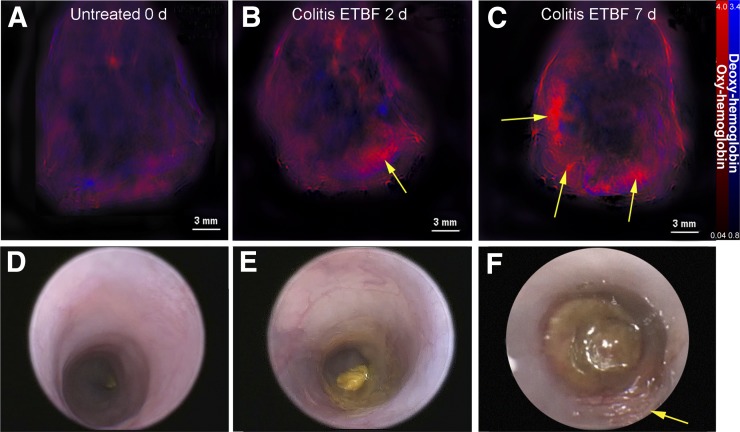
MSOT depicts inflammatory changes in murine colitis. Wild-type C57B/6 mice were orally inoculated with either phosphate-buffered saline alone (control) or ETBF. (A) MSOT imaging of mice before ETBF treatment (untreated). (B and C) Images of mice 2 and 7 d, respectively, after bacterial inoculation. Arrows indicate concentrated areas of oxyhemoglobin corresponding to colitis (B and C). Findings on MSOT were compared with colonoscopic findings (D–F) for each group of mice. Arrow indicates area of inflammation indicative of colitis (F).

