Figure 3.

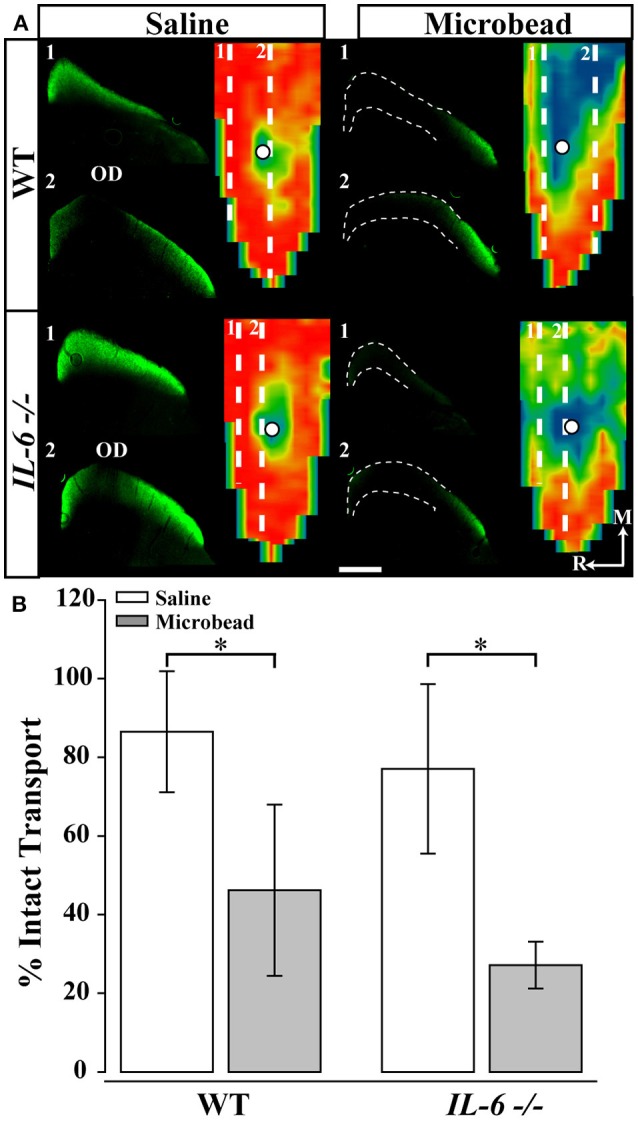
IL-6 deficiency does not alter IOP-dependent deficits in anterograde axon transport. (A) Representative coronal sections through the superior colliculus (SC) and respective retinotopic heat maps after 5 days of CTB transport in WT (top) and (bottom) IL-6-/- mice. Outlines in coronal sections indicate areas of transport deficits. Dashed lines in map indicate position of coronal section. Density of the CTB signal for heat maps range from 0% (blue) to 50% (green) to 70% (yellow) to 100% (red). Numbered, dashed lines in retinotopic maps indicate the location of respective coronal section and white circles indicate position of the optic disk (OD). Medial (M) and rostral (R) orientations are indicated. (B) Bar graph showing average percent intact transport (mean ± STDEV, >70% density of CTB signal; red/yellow areas) from SC following saline (white) or microbead (gray) injection in WT (left) and IL-6-/- (right) mice. SC from both microbead- injected WT and IL-6-/- mice show a ~50% deficit in intact axon transport compared to saline- injected mice. *p < 0.05. n = 5–6 SC/genotype/condition. Scale bars = 500 μm for all images.
