Figure 4.
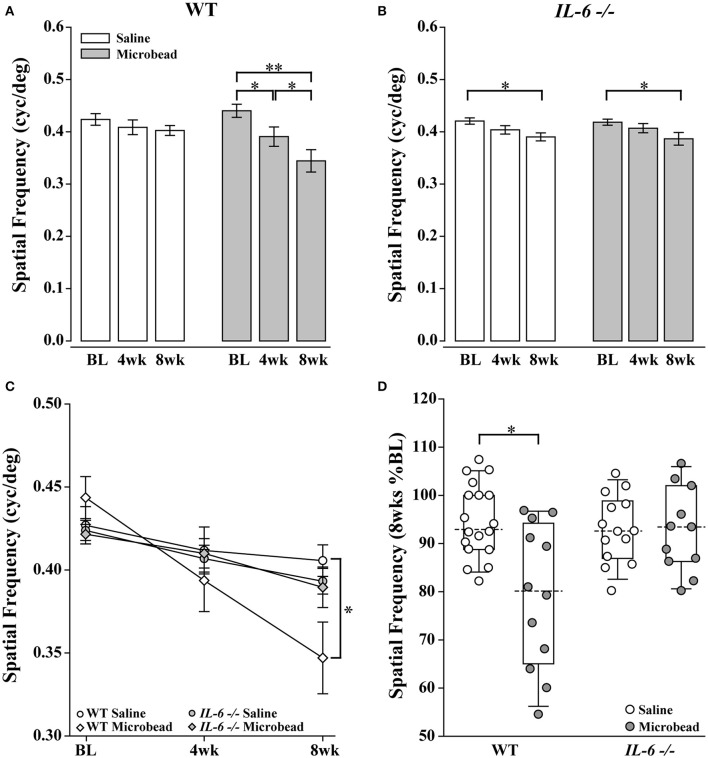
IL-6-/- mice are resistant to IOP-induced deficits in visual acuity. (A) Bar graph showing average visual acuity threshold (mean ± SEM) of WT mice at baseline and 4 and 8 weeks post initial saline (white) or microbead (gray) injection. WT mice injected with microbeads show a significant decrease in visual acuity at both 4 weeks and 8 weeks post-injection compared to baseline. (B) Bar graph showing average visual acuity threshold (mean ± SEM) of IL-6-/- mice at baseline and 4 and 8 weeks post initial saline (white) or microbead (gray) injection. IL-6-/- mice injected with either saline or microbeads show a significant decrease in visual acuity at 8 weeks compared to baseline. (C) Line graph comparing visual acuity of WT saline (white circle), WT microbead (white diamond), IL-6-/- saline (gray circle) and IL-6-/- microbead (gray diamond) at each time point. Visual acuity decreases significantly in microbead-injected WT mice compared to saline-injected WT mice. Visual acuity does not differ between saline- and microbead- injected IL-6-/- or between genotypes. (D) Boxplot of the percent visual acuity remaining at 8 weeks compared to baseline measurements for WT and IL-6-/-. WT mice injected with microbeads show a significant decrease in the remaining visual acuity when compared to the saline- injected WT mice. IL-6-/- mice injected with microbeads show no difference in the remaining visual acuity when compared to the saline injected IL-6-/- cohort. *p < 0.05, **p < 0.001. n = 13–17/group. Dashed lines in boxplot indicate median value of data set.

