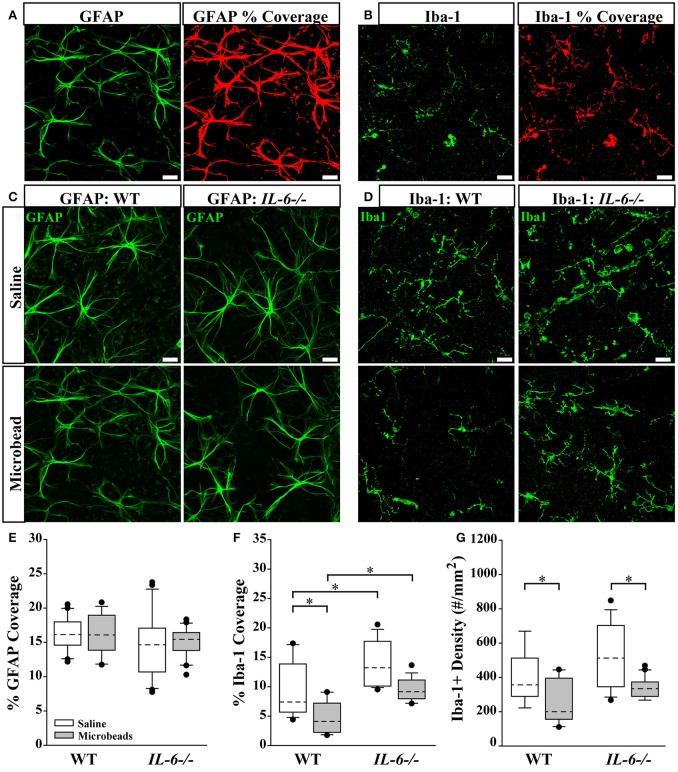
Figure 6.
IL-6 deficiency affects microglial coverage regardless of IOP. (A,B) Representative 60X confocal images depicting quantification of percent coverage of GFAP+ astrocytes (green; A, left) and Iba-1+ microglia (green; B, left). The area containing above background signal for GFAP and Iba-1 was highlighted in red (A,B; right) and divided against the total area of the image to obtain the percent coverage measurements. (C,D) Representative 60X confocal images depicting GFAP+ astrocyte (green; C) and Iba-1+ microglia (green; D) labeling in whole mount retina of microbead- and saline- injected WT and IL-6-/- eyes. (E) Boxplot of percent coverage of GFAP+ astrocytes in saline (white) and microbead (gray) injected WT (left) and IL-6-/- (right) eyes. No genotype or IOP dependent changes were calculated. (F) Boxplot of percent coverage of Iba-1+ microglia in saline- (white) and microbead- (gray) injected WT (left) and IL-6-/- (right) eyes. While an IL-6 dependent increase in percent coverage of microglia is seen in both saline and microbead- injected eyes, only an IOP dependent decrease is seen in microbead- injected WT eyes. (G) Boxplot of Iba-1+ microglia cell density (counts/mm2) in saline- (white) and microbead- (gray) injected WT (left) and IL-6-/- (right) eyes. IOP dependent decreases in microglia counts are evident in microbead- injected eyes are evident in both WT and IL-6-/- eyes. *p < 0.05. n = 6–8 images/eye/condition/genotype. Scale bars= 30 μm for all images. Dashed lines in boxplot indicate median value of data set.

