
Fig. 3.
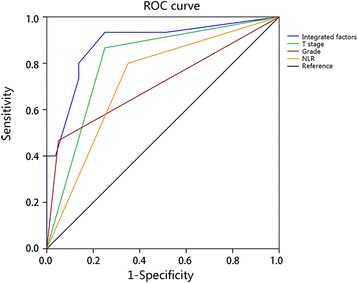
The ROC curve of the multivariate logistic regression model. The ROC curve illustrated integrated factors have an AUC of 0.885 (95% CI 0.783–0.987), which is larger than using the individual factors of NLR (0.725, 95% CI 0.591–0.859), T stage (0.808, 95% CI 0.693–0.924), and grade (0.708, 95% CI 0.541–0.876)