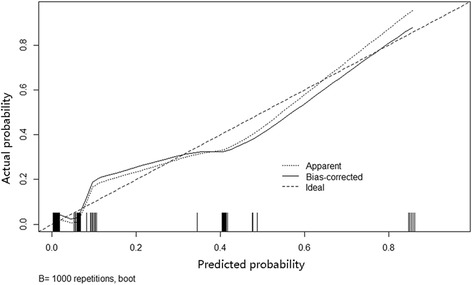
Fig. 4.

Calibration plot of nomogram. The dashed line indicates the ideal nomogram in which predicted and actual probabilities were perfectly identical. The dotted line indicates actual nomogram performance. The solid line presents the bootstrap corrected performance of our nomogram. The calibration plot illustrates a good predictive accuracy
