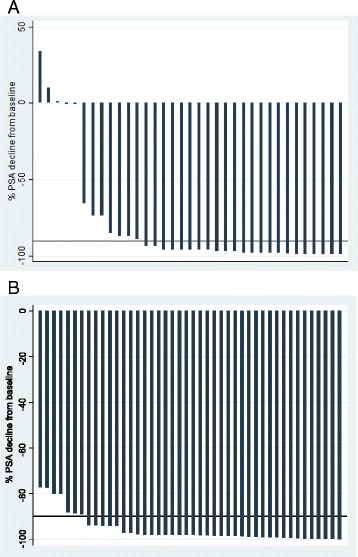
Fig. 1.

Waterfall plots of relative PSA decline from baseline for patients with (a) and without (b) clinical progression during study follow-up (median 15 months). A decline of ≥90% was seen in 23 (65.7%) and 37 (84.1%) patients in (a) and (b) respectively. This was not statistically significant (p = 0.06). The bold reference line represents PSA decline of 90%
