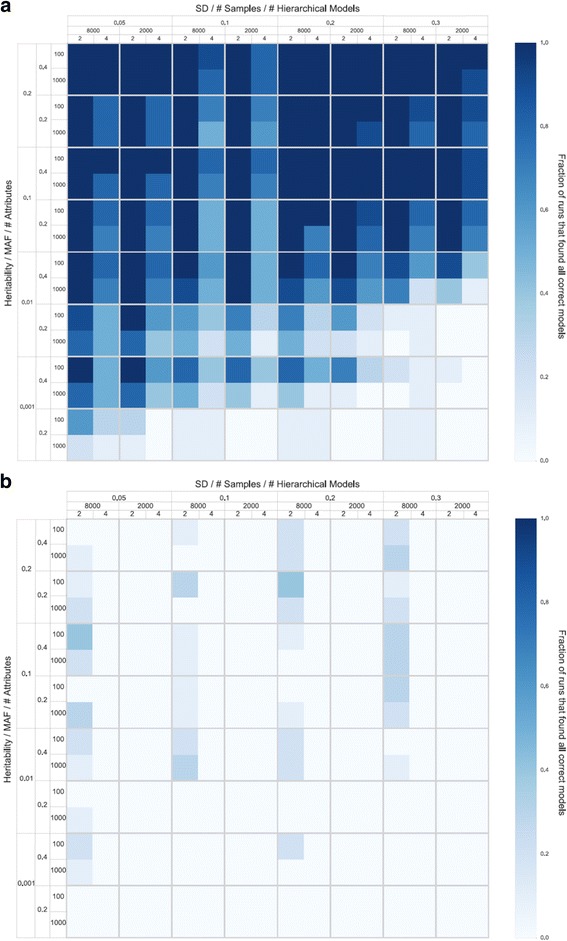
Fig. 1.

Heatmaps summarizing the results of the simulation study. The dark blue shading indicates a detection success rate of 80% or greater for each particular heritability, minor allele frequency (MAF; 0.2 and 0,4), total number of SNPs (100 and 1000), size of the embedded ‘target’ models (i.e. the number of SNPs they contain; 2 and 4), sample size (2000 and 8000), and trait standard deviation combination (0.05, 0.1, 0.2, and 0.3). Panel a represents the described Crush-MDR search. Panel b represents a random search with the same number of evaluations
