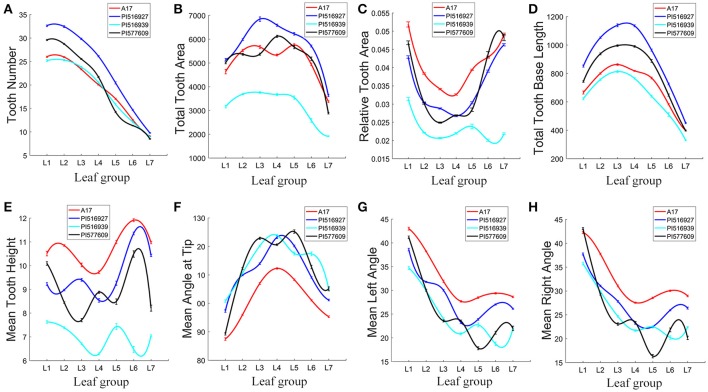
Figure 11.
Analysis of leaflet serration features of leaves in M. truncatula natural variants. To fit the variance of average of serration parameters among seven leaf groups (L1–L7), cubic spline curve fitting was used. Shown are tooth number (A), total tooth area (B), relative tooth area (C), total tooth base length (D), mean tooth height (E), mean angle at tip (F), mean left angle (G), and mean right angle (H) of L1–L7 in 7-week-old plants. M. truncatula cv. Jemalong A17, PI516927, PI516939, and PI577609 plants are shown in different colors.

