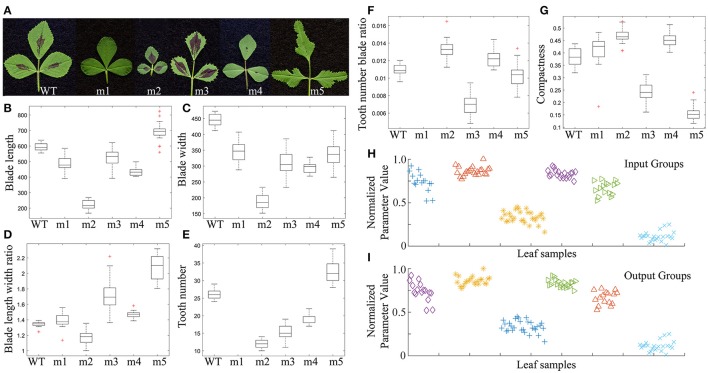
Figure 14.
Comparison and classification of leaf shape mutants of Medicago truncatula. (A) Morphologies of mature leaves of 2-month-old M. truncatula wild type (WT; Jemalong A17), and FN3296 (m1), FN1923 (m2), FN20816 (m3), FN1924 (m4), and FN10068 (m5) mutant plants. (B–G) Box plots of the leaflet blade and serration parameters, blade length (B), blade width (C), blade length width ratio (D), total tooth number (E), tooth number blade ratio (F), and compactness (G). Middle lines denote the median values, upper and lower edges of boxes denotes the 75th and 25th percentiles, respectively, whiskers denote the most extreme data points that are not considered outliers, and outliers are marked individually, n = 9–20. (H,I) Classification of leaf sample groups using the k-means clustering method. (H) Leaf sample groups before classification. (I) Leaf sample groups after classification. Shown are leaf sample groups from m1, m2, m3, m4, WT, and m5 plants from left to right.

