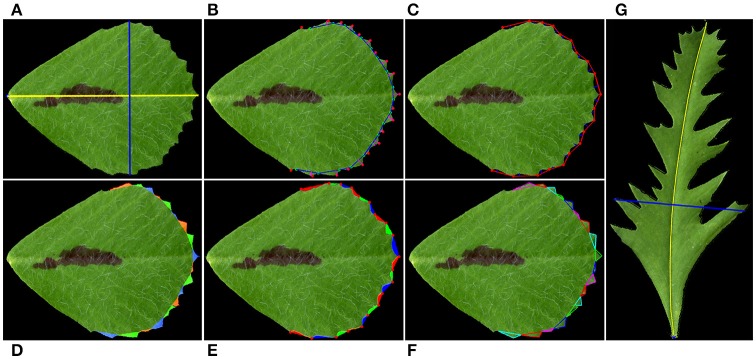
Figure 2.
Illustration of leaflet blade and serration parameters measured by the software. (A) Blade length (yellow line) and width (blue line). (B) Serration (tooth) tips (red dots), sinus (valley) bottoms (cyan dots), tooth base lines (blue lines), and tooth heights (red lines). (C) Valley depth (blue lines). Tooth tips are connected by straight lines (red lines). (D) Tooth areas (color coded). (E) Valley areas (color coded). (F) Tooth tip, left and right angles. The software draws a triangle from a tooth tip to two neighboring valley bottoms to estimate the tooth angles. (G) The blade length (yellow line) was manually adjusted as a curved line to overlie the midvein of a leaflet of a leaf shape mutant. The blade width (blue line) was automatically selected as the longest line orthogonal to the blade length.

