Figure 8.
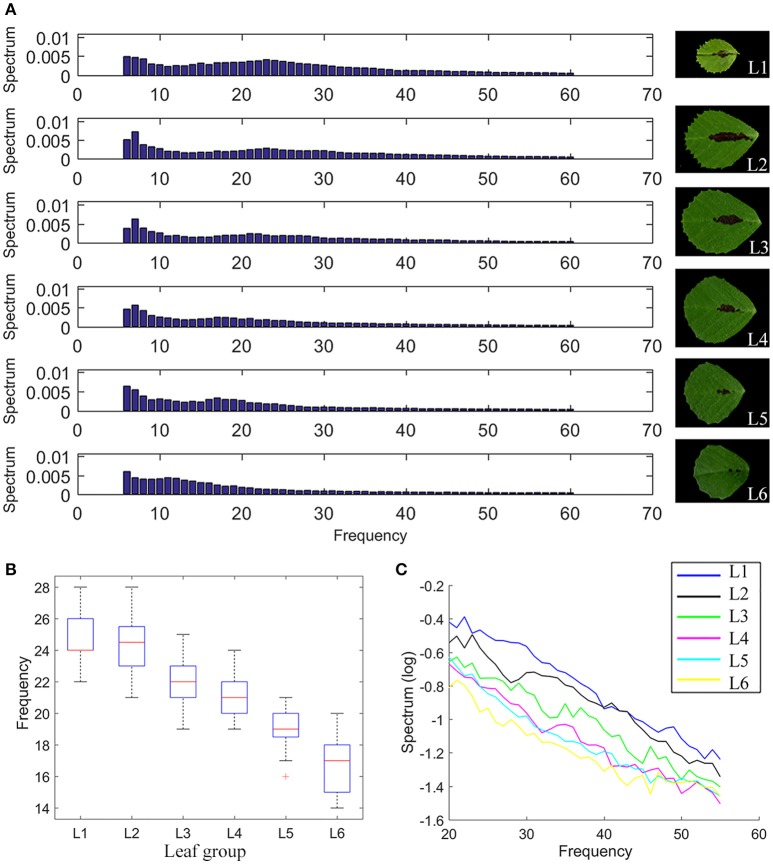
Elliptic Fourier analysis of M. truncatula wild-type leaves. (A) Intensity distribution of the spectral frequency components of the elliptic Fourier analysis of compound leaf 1 (L1) to compound leaf 6 (L6) in 6-week-old M. truncatula cv. Jemalong A17 plants, showing a gradual shift from high frequency to low frequency components from L1 to L6. Right panels show representative images of corresponding leaflets. (B) A boxplot of 50% frequency of L1–L6. Red lines denote the median values, upper and lower edges of boxes denote 75 and 25% percentiles, respectively, whiskers denote the most extreme data points that are not considered outliers, and outliers are marked individually, n = 32. (C) Decrease of Alpha components (20th–60th spectral components) from L1 to L6.

