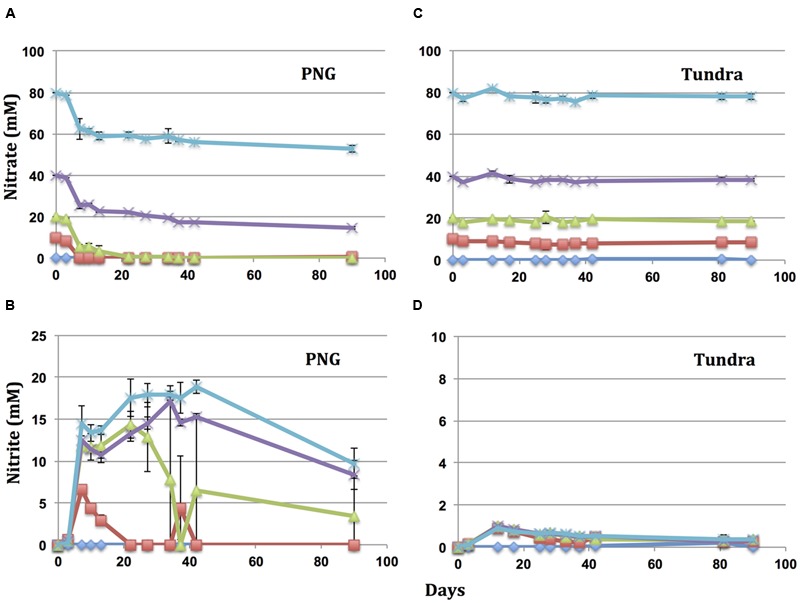
FIGURE 2.

Reduction of nitrate and formation of nitrite as a function of time in microcosms with PNG oil (A,B) and Tundra oil (C,D). All microcosms were inoculated with a 10% (v/v) inoculum of produced water from 18PW in the MHGC field. The initial nitrate concentrations were 80 ( ), 40 (×), 20 (
 ), 10 (
 ), or 0 (
 ) mM. Error bars represent the standard deviations for four measurements.
