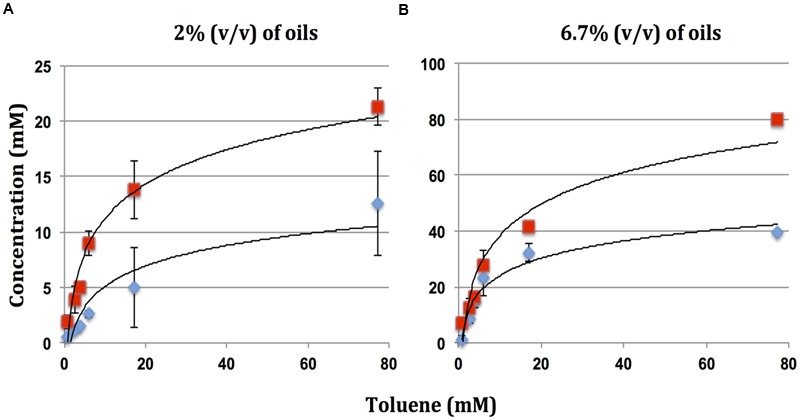
FIGURE 4.

Maximum reduction of nitrate ( ) and formation of nitrite (
 ) in microcosms incubated with oils with different toluene concentrations for 90 days. Data are for (A) serum bottles and (B) Hungate tubes. Error bars represent the standard deviations for eight replicate measurements.
