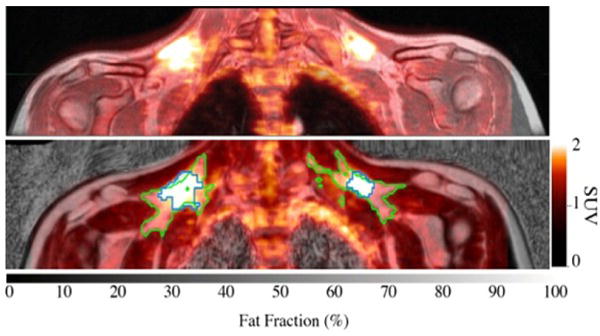
Figure 1.

Top: Fused FDG-PET/MR image of the upper torso. Bottom: Glucose uptake map overlaid onto a fat fraction MR map. Green line contours adipose tissue within supraclavicular area with a fat fraction >40%; blue line contours sFAT with SUV values above 1.5.
