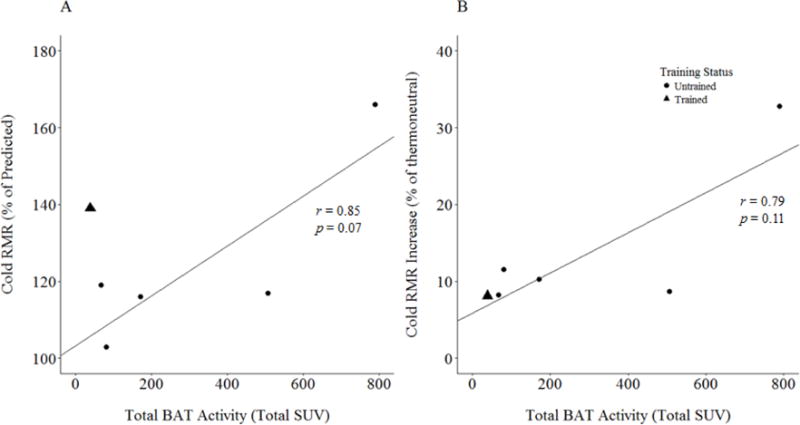
Figure 7.

(A) Resting metabolic rate (RMR) during cold exposure, presented as a percentage of predicted RMR, vs. total sFAT activity (total SUV). (B) Cold RMR, presented as the percent increase from the thermoneutral condition, vs. total sFAT activity (total SUV). Best fit lines calculated from untrained subjects only. Predicted values were determined based on sex, weight, height, and age using the Harris-Benedict equation.
