
Figure 3.
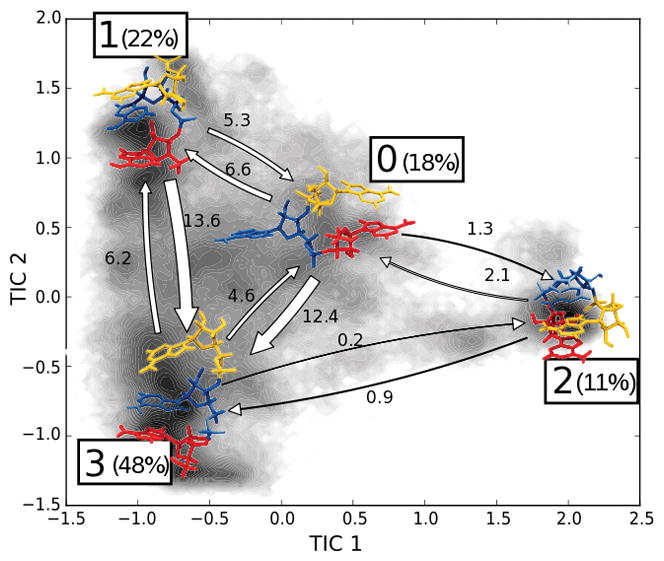
Schematic representation of the 4-state HMM of AAA. A1 (red), A2 (blue), A3 (yellow). Percentages indicate the equilibrium population of each state; the width of the arrows is proportional to the transition rate between the states which are also indicated in μs−1 units. Shading indicates the distribution of the simulation data on the TICA plane.