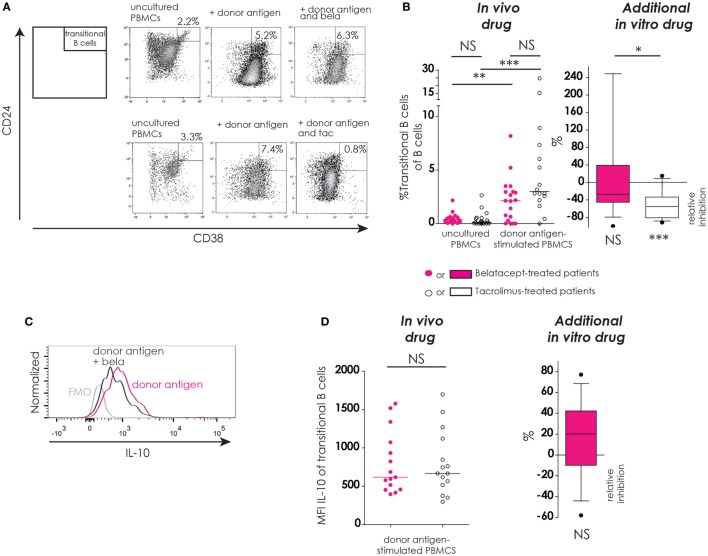
Figure 6.
Transitional B-cells and their donor antigen-driven IL-10 production were conserved by belatacept in vitro but inhibited by tacrolimus. The gating strategy is depicted for transitional B-cells (CD24+CD38++) after donor antigen stimulation (A). Cells were gated from CD19+ B-cells like depicted in Figure 4A. The proportions of transitional B-cells are shown for 7-day donor antigen-stimulated peripheral blood mononuclear cells (PBMCs) obtained from the belatacept or tacrolimus group (“in vivo” column), as well as the relative inhibitions by in vitro addition of belatacept or tacrolimus (“additional in vitro” column) (B). A typical example is depicted for intracellular IL-10 expression [median fluorescence intensity (MFI)] by transitional B-cells after 7 days of donor antigen stimulation, in the presence or absence of belatacept, including a Fluorescence-Minus-One control (FMO) (C). The MFIs of IL-10 within transitional B-cells are shown for 7-day donor antigen-stimulated PBMCs obtained from the belatacept or tacrolimus group (“in vivo” column), as well as the relative inhibitions by in vitro addition of belatacept (“additional in vitro” column) (D). The MFI of IL-10 within transitional B-cells could not be reliably determined in the presence of tacrolimus in vitro, because of the decreased transitional B-cells survival in the presence of tacrolimus. In the graph in the “In vivo drug” column in (B), proportions of transitional B-cell populations were compared (i) between belatacept- and tacrolimus-treated patients in uncultured, unstimulated PBMCs; (ii) between belatacept- and tacrolimus-treated patients in 7-day donor antigen stimulated PBMCs; (iii) between uncultured, unstimulated PBMCs and 7-day donor antigen stimulated PBMCs in belatacept-treated patients; and (iv) between uncultured, unstimulated PBMCs and 7-day donor antigen stimulated PBMCs in tacrolimus-treated patients. Every dot represents PBMCs of a single patient. In the graphs in the “Additional in vitro drug” column the relative inhibitions by additional in vitro belatacept and tacrolimus are depicted for aforementioned cell populations in the same belatacept- and tacrolimus-treated patients. The proportions of these cell populations after donor antigen stimulation in the absence of in vitro drugs are set to 0. The median relative inhibitions by belatacept and tacrolimus were tested against a theoretical median of 0. Asterisks below boxes depict the p-values of these tests. The relative inhibitions were compared between in vitro belatacept and tacrolimus. Lines in boxes represent medians, borders of boxes represent 25th and 75th percentiles, error bars present 10th and 90th percentiles. Every box represents cultures of PBMCs obtained from n = 20 belatacept-treated or n = 20 tacrolimus-treated patients. *p < 0.05, **p < 0.01, ***p < 0.001, ****p < 0.0001, NS, not significant. N.B.: The MFI slightly decreases in antigen-stimulated cells compared to unstimulated cells, partly because of the intracellular staining protocol that was used to determine intracellular cytokine expression. Therefore, the gates in the unstimulated and stimulated cells are not exactly the same.

