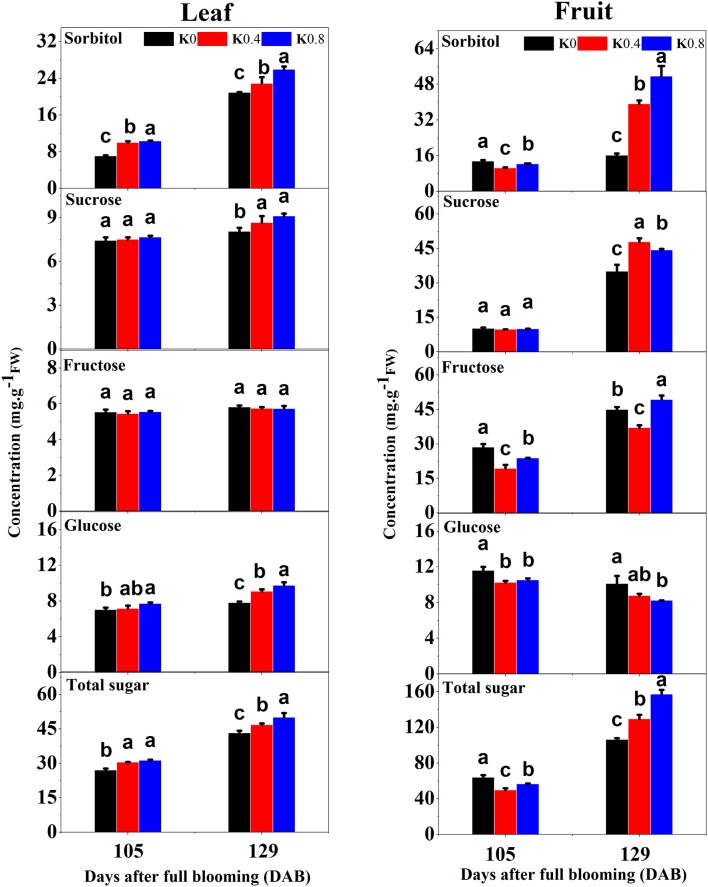
Figure 2.
Effect of different potassium (K) levels on sorbitol, sucrose, fructose, glucose, and total sugar concentration of the leaves and fruit of “Huangguan” pear at 105 and 129 DAB. Each point represents the average of six samples. Error bars represent SE. Statistical analysis was performed by LSD test at P < 0.05.

