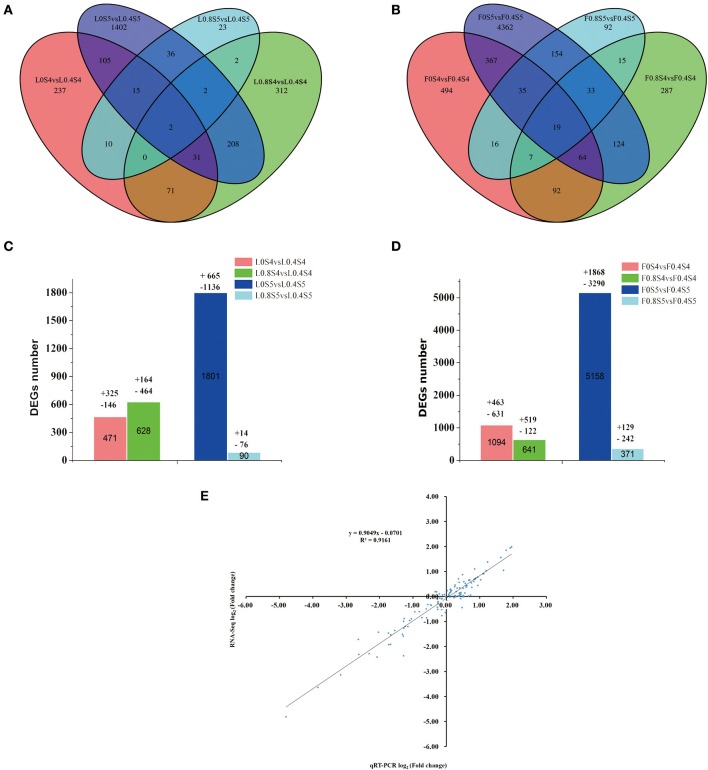
Figure 4.
Venn diagram of the differentially expressed genes (DEGs) of RNA-Seq (y axis) and qRT-PCR data (x axis). (A,B) Venn diagram showing the number of differentially expressed genes (P < 0.05 and fold change equal or greater than 2) from 105 to 129 DAB under different K levels. (C,D) The total number of DEGs, up-regulated and down-regulated, in leaf and fruit between 105 days and 129 DAB. (E) A qRT-PCR assay was carried out for 17 randomly selected DEGs. Values are the log2 ratio (low K/Control or high K/Control) for genes. The correlation coefficient (R2) is indicated in the figure.

