
Table 2. Data collection and refinement statistic for HSA–Zn2+ and ESA–Zn2+ structures. Values in parentheses are for the highest resolution shell.
| PDB ID | 5IJF | 5IIH | 5IIU | 5IIX | 5IJE | 5IJ5 |
| Albumin | HSA | ESA | ESA | ESA | ESA | ESA |
| Zn2+ conc. (mM) | 0.5 | 2.5 | 10 | 15 | 30 | 50 |
| pH | 9.0 | 7.4 | 6.9 | 6.5 | 7.4 | 4.5 |
| Data collection | ||||||
| Wavelength (Å, keV) | 0.979, 12 664 | 0.979, 12 664 | 0.979, 12 664 | 0.979, 12 664 | 1.282, 9668, 1.289, 9618 | 0.979, 12 664 |
| Space group | C2221 | P61 | P61 | P61 | P61 | P61 |
| Unit-cell parameters | ||||||
| a, b, c (Å) | 78.6, 121.6, 140.0 | 93.10, 93.10, 141.44 | 93.75, 93.75, 141.79 | 94.31, 94.31, 141.49 | 94.38, 94.38, 141.91 | 96.13, 96.13, 144.15 |
| α, β, γ (°) | 90.0, 90.0, 90.0 | 90.0, 90.0, 120.0 | 90.0, 90.0, 120.0 | 90.0, 90.0, 120.0 | 90.0, 90.0, 120.0 | 90.0, 90.0, 120.0 |
| Resolution range (Å) | 50.0–2.65 (2.70–2.65) | 50.0–2.40 (2.44–2.40) | 80.0–2.30 (2.34–2.30) | 80.0–2.20 (2.24–2.20) | 50.00–2.40 (2.40–2.44) | 50.00–2.55 (2.55–2.59) |
| Completeness (%) | 98.9 (88.4) | 99.6 (99.3) | 99.3 (99.0) | 100 (100) | 99.5 (99.9) | 99.9 (100.0) |
| Total number of reflections | 143 674 | 208 207 | 300 971 | 277 833 | 120 428 | 151 772 |
| No. of unique reflections | 19 741 | 25 677 | 31 099 | 36 226 | 27 885 | 23 268 |
| Mean I/σ(I) | 28.7 (2.1) | 32.2 (2.1) | 29.1 (1.9) | 31.1 (2.2) | 23.0 (2.1) | 23.8 (2.0) |
| CC1/2 – highest resolution shell | 0.84 | 0.85 | 0.89 | 0.89 | 0.79 | 0.70 |
| Redundancy | 7.3 (6.6) | 7.7 (7.7) | 9.7 (9.4) | 7.7 (7.5) | 4.3 (4.1) | 6.2 (5.7) |
| R merge a (%) | 7.1 (82.0) | 7.1 (96.5) | 7.8 | 8.9 (79.5) | 7.9 (70.7) | 0.107 |
| Structure refinement | ||||||
| R work b (%) | 21.3 | 17.5 | 17.9 | 17.8 | 19.5 | 18.9 |
| R free b (%) | 29.2 | 23.5 | 23.9 | 22.8 | 25.5 | 25.3 |
| Bond lengths RMSD (Å) | 0.008 | 0.009 | 0.008 | 0.008 | 0.008 | 0.044 |
| Bond angles RMSD (°) | 1.2 | 1.2 | 1.2 | 1.2 | 1.2 | 1.2 |
| Mean B value (Å2) | 105 | 72 | 62 | 58 | 55 | 76 |
| Number of protein atoms | 4279 | 4501 | 4514 | 4484 | 4463 | 4411 |
| Mean B value for protein atoms (Å2) | 105 | 72 | 62 | 58 | 56 | 76 |
| Number of water molecules | 40 | 133 | 193 | 364 | 296 | 159 |
| Mean B value for water molecules (Å2) | 85 | 61 | 56 | 57 | 50 | 66 |
| Number of ligands/ions atoms | 9 | 6 | 15 | 50 | 18 | 21 |
| Mean B value for ligands/ions atoms (Å2) | 92 | 110 | 86 | 74 | 73 | 94 |
| Clash score | 0.97 | 0.79 | 0.79 | 0.45 | 0.92 | 0.58 |
| Clash score percentile | 100 | 100 | 100 | 100 | 100 | 100 |
| Rotamer outliers (%) | 0.24 | 0.83 | 0.83 | 0.21 | 0.64 | 0.66 |
| Ramachandran outliers (%) | 0.00 | 0.00 | 0.00 | 0.00 | 0.00 | 0.00 |
| Ramachandran favored (%) | 97.71 | 98.27 | 97.93 | 98.25 | 98.62 | 98.10 |
| Residues with bad bonds (%) | 0.00 | 0.00 | 0.00 | 0.00 | 0.00 | 0.00 |
| Residues with bad angles (%) | 0.00 | 0.00 | 0.00 | 0.00 | 0.00 | 0.00 |
| MolProbity score | 0.85 | 0.75 | 0.77 | 0.66 | 0.78 | 0.69 |
a
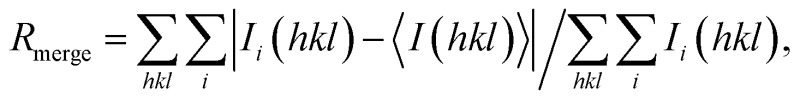 where I(hkl) is the mean of I observations I
i(hkl) of reflection hkl.
where I(hkl) is the mean of I observations I
i(hkl) of reflection hkl.
b
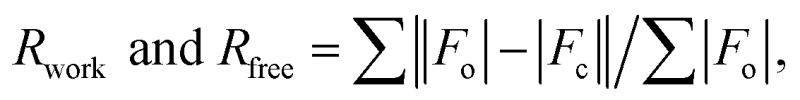 where F
o and F
c are the observed and calculated structure factors, respectively, calculated for working set (R
work) and for 5% of the data omitted from refinement (R
free).
where F
o and F
c are the observed and calculated structure factors, respectively, calculated for working set (R
work) and for 5% of the data omitted from refinement (R
free).