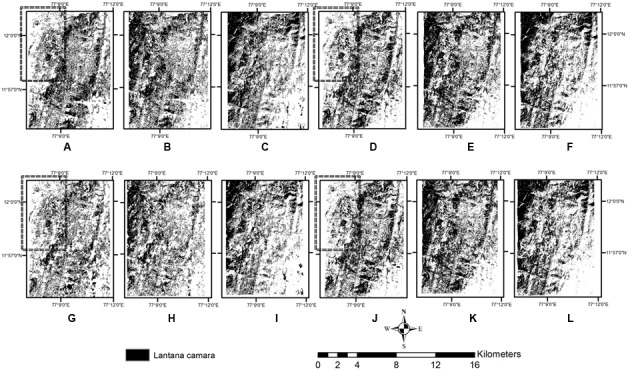
FIGURE 6.

Comparison of Lantana mapped with thresholding of different indices with object-based (A–C,G–I) and pixel-based classification (D–F,J–L) using two season data. (A,D,G,J) are obtained from SAVI, (B,E,H,K) are obtained from Green–Red index, and (C,F,I,L) are obtained from Blue–Green–NIR index. A–F are obtained with the use of texture, G–L are obtained without texture. Rectangle highlights area where Lantana was undetected using SAVI.
