. 2016 Aug 9;7(12):6865–6886. doi: 10.1039/c6sc02555b

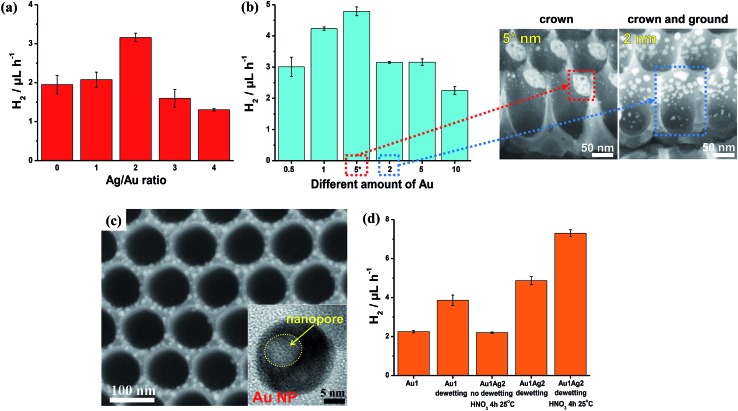
Fig. 10. (a, b and d) Photocatalytic H2 evolution rate (r H2, 5 h-long runs) measured for (a) different Ag/Au ratios (all samples were prepared by sputter-coating 5 nm-thick Au films and different amounts of Ag, followed by dewetting and a 2 h-long dealloying step at 15 °C), (b) different amounts of Au (nm) with constant Ag/Au ratio of 2 : 1 (all samples were dewetted and then subjected to a 2 h-long dealloying step at 15 °C – SEM images are relative to the samples labelled in (b) as “5*” and “2”), and (d) different Au/TiO2 photocatalysts prepared by depositing a 1 nm-thick layer of Au (the plot highlights that an optimized combination of dewetting–dealloying can lead to a ∼4 times increase of the H2 generation rate); (c) SEM and TEM (inset) images of TiO2 NTs decorated with porous Au–Ag NPs (by dewetting–dealloying of 1 nm-thick Au and 2 nm-thick Ag films). Fig. (a–d) are reproduced with permission from ref. 120.

Fig. 10