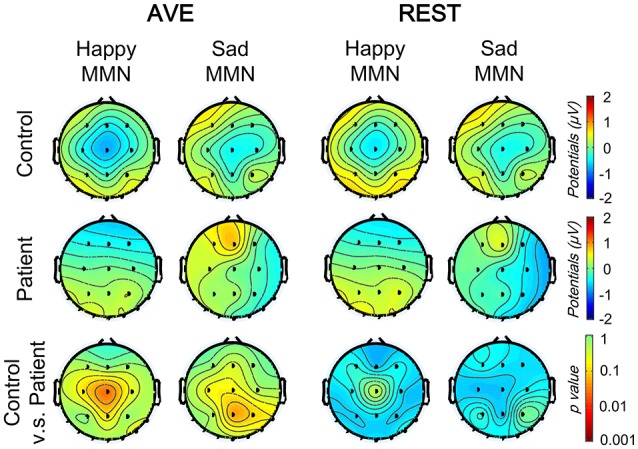
Figure 6.

Comparison of vMMN topographic distributions using two reference-modes (AVE and REST). The topographic distributions of facial expression vMMNs (100–400 ms) under two conditions (happy and sad deviant) in control (top) and patient (middle) groups, and between group significance analyses (bottom, with Bonferoni correction). AVE, average reference; REST, reference electrode standardization technique.
