
Figure 4. IL4 activates wound-associated genes in rebound TAMs and is produced by T cells in the rebound tumor microenvironment.
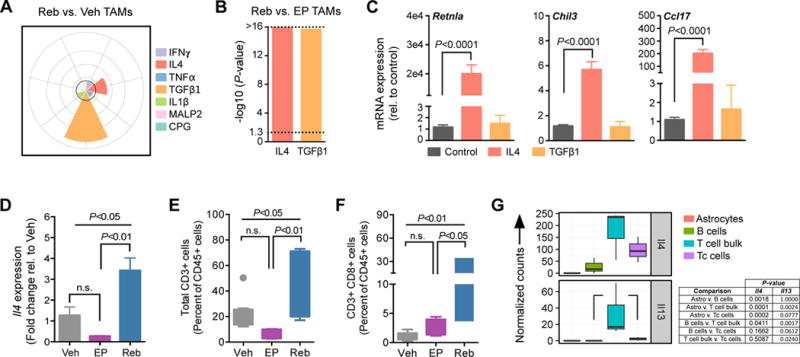
(A) Spectrum model of macrophage activation using gene set enrichment analysis (GSEA) of transcriptional programs regulated by the indicated cytokines (see methods). Reb TAMs exhibit activation of programs driven by TGFβ1 and IL4 compared to Veh TAMs (n=5 per group). The -log10 (P-value) is plotted for each gene set (0, 4, 8, 12, and >16 radially outward in grey concentric circles). The black line indicates a -log10 (P-value) cutoff of 3. (B) GSEA as in (A), confirming that Reb TAMs exhibit activation of programs driven by IL4 and TGFβ1 compared to EP TAMs (n=5–6 per group). Dotted line demarcates P<0.05. (C) qRT-PCR analysis demonstrates that IL4 induces expression of the wound-associated genes Retnla, Chil3 and Ccl17 in bone marrow-derived macrophages (BMDMs) in culture, while recombinant TGFβ1 treatment does not. Bone marrow isolate was obtained from 5 or more independent WT mice for replicate experiments. (D) qRT-PCR analysis of Il4 expression in snap frozen whole-tumor samples from Veh, EP or Reb treatment groups, demonstrating elevated expression in the Reb setting (n=4 tumors) compared to both Veh (n=4 tumors) and EP (n=4 tumors). (E) Flow cytometry of total CD3+ T cells (n=5–10) and (F) CD3+ CD8+ cytotoxic T cells (n=5–10) in Veh, EP and Reb tumors. (G) RNA-seq data from a panel of cell types (GFAP+ astrocytes, CD19+ B cells, CD3+ CD8+ cytotoxic T cells (Tc), and remaining CD3+ CD8- bulk T cells) isolated from rebound tumors by FACS (n=3,). Results show elevated Il4 expression in bulk T and Tc cells, and Il13 expression in bulk T cells. Significance values for C-F were calculated by one-way ANOVA and Tukey’s multiple comparisons test.