
Figure 5. The IGF-1/IGF-1R axis is induced in rebound gliomas.
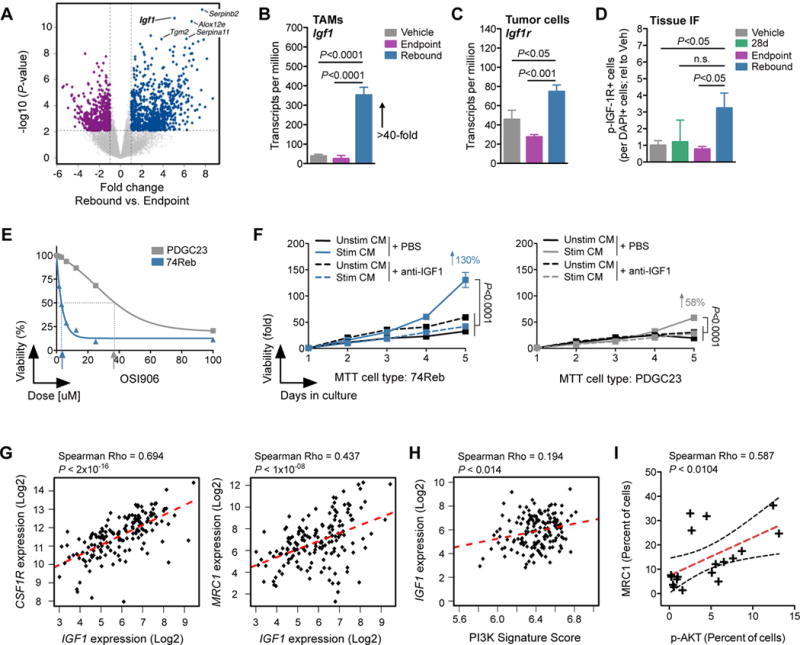
(A) Volcano plot showing the fold change (log2(fold)) between Reb (n=5) and EP (n=6) TAMs on the x-axis and the significance (−log10(P-value)) on the y-axis. Blue dots indicate genes upregulated in Reb TAMs, while purple dots indicate genes downregulated in Reb TAMs. Igf1 is labeled in the upper right quadrant. (B) RNA-seq barplot depicting Igf1 transcripts per million (TPM) in Veh, EP and Reb TAMs (n=5–6 per group; one-way ANOVA and Tukey’s multiple comparisons). (C) RNA-seq barplot depicting Igf1r TPM in Veh, EP and Reb tumor cells (n=5–6 per group; one-way ANOVA and Tukey’s multiple comparisons). (D) Quantification of immunofluorescent staining of phospho (p)-IGF-1R in Veh, 28d, EP and Reb tumor tissues. Results show pIGF-1R is elevated in rebound tumors compared to all other groups (n=5–8 per group; one-way ANOVA and Dunnett’s multiple comparisons to Reb). (E) MTT assay demonstrating higher sensitivity of an early-passage primary rebound PDG cell line (74Reb, blue) to IGF-1R inhibition with OSI906 compared to a primary treatment-naïve PDG cell line (PDGC23, grey) (n=3, one representative experiment shown). IC50 values are indicated with arrows. (F) MTT proliferation assays of 74Reb cells (left) compared to PDGC23 cells (right), treated with conditioned media (CM) from BMDMs that were stimulated with rebound glioma microenvironment culture CM (see fig. S8, I and J for details). Stimulated BMDM CM (Stim CM) induced growth of 74Reb cells more than PDGC23 cells (130% versus 58%, respectively), and this effect was blocked with an anti-IGF-1 neutralizing antibody (n=4 replicate experiments). A one-way ANOVA and Dunnett’s multiple comparisons to Stim CM + PBS was used to calculate differences at 5d (P<0.0001 for all). (G) Correlation between IGF1 and CSF1R or MRC1 expression from TCGA-GBM data. (H) Single sample GSEA for a hallmark PI3K signature was used to assign a pathway activity score (see methods) across patients from the TCGA-GBM dataset. PI3K signature scores were then correlated with IGF1 expression levels as shown. (I) Linear regression analysis of immunohistochemical staining for phospho (p)-AKT and MRC1 in serial sections from GBM patient tissue (n=18 patients). A significant correlation between MRC1 protein levels and AKT signaling was observed. For correlational analyses (G-I), a Spearman coefficient was used to assess significance, and a line of best fit is shown (red hatched). The 95% confidence band (black hatched) is also shown in (I).