
Figure 6. NFAT and Stat6 cooperate to regulate Igf1 expression in rebound TAMs.
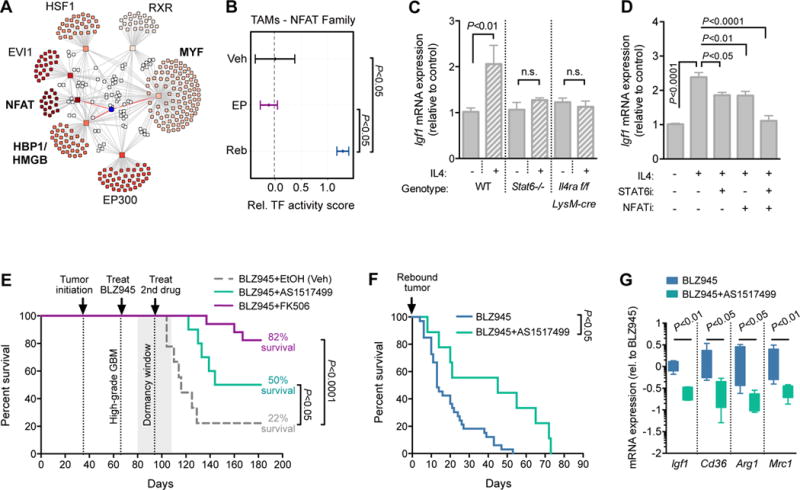
(A) Transcription factor (TF) network analysis from RNA-seq data showing enriched TF families (squares) connected with a line to target genes (circles). White circles indicate genes targeted by multiple TFs. Igf1 is shown as a blue circle connected by red lines to three regulating TF families. (B) Predicted NFAT TF activity in Veh, EP and Reb TAMs, showing a high score specifically in Reb TAMs (n=5–6 per group). (C) qRT-PCR analysis of Igf1 in BMDMs derived from WT, Stat6−/− or Il4ra flox; LysM-cre mice, treated +/− recombinant mouse IL4 (10 ng/ml; n=5 independent experiments). Student’s t-test was used for pairwise comparisons within each genotype. (D) qRT-PCR analysis of Igf1 in BMDMs derived from WT mice, treated +/− recombinant mouse IL4 (10 ng/ml), a Stat6 inhibitor (AS1517499, 50 nM) and/or an NFAT inhibitor (INCA-6, 40 μM; n=6 independent experiments). A one-way ANOVA and Dunnett’s multiple comparisons to the +IL4 condition was used to calculate significance. (E) Survival of PDG animals with high-grade tumors treated first with BLZ945 alone until dormancy (28d), and then enrolled on combination therapy with either AS1517499 (n=10), FK506 (NFAT inhibitor; n=17), or EtOH vehicle control (n=9). Combination therapy with either inhibitor led to a significant increase in overall survival (FK506= 82% survival P<0.0001; AS1517499= 50% survival P<0.05), compared to vehicle control (22% survival). Log-rank Mantel-Cox test was used to calculate significance. (F) Survival curve representing animals with recurrent tumors treated either with continuous BLZ945 alone (n=33) or BLZ945+AS1517499 (n=9). Combination therapy led to a significant increase in overall survival (Log-rank Mantel-Cox test, P<0.05), and in median survival following recurrence (45d) compared to BLZ945 monotherapy (13d). (G) qRT-PCR analysis of Igf1, CD36, Arg1 and Mrc1 levels in a subset of animals from (F). Results show a significant reduction of Igf1 expression in rebound tumors following Stat6 inhibition (n=5 per group, P<0.01), and a reduction of known IL4-Stat6 transcriptional targets (CD36 Pπ.05 Arg1 P<0.05; Mrc1 P<0.01), confirming drug efficacy in the brain (n=5 for all, Mann-Whitney test).