
Figure 1. Lineage tracing systems demonstrate heterogeneity in TAM ontogeny in multiple models of glioma.
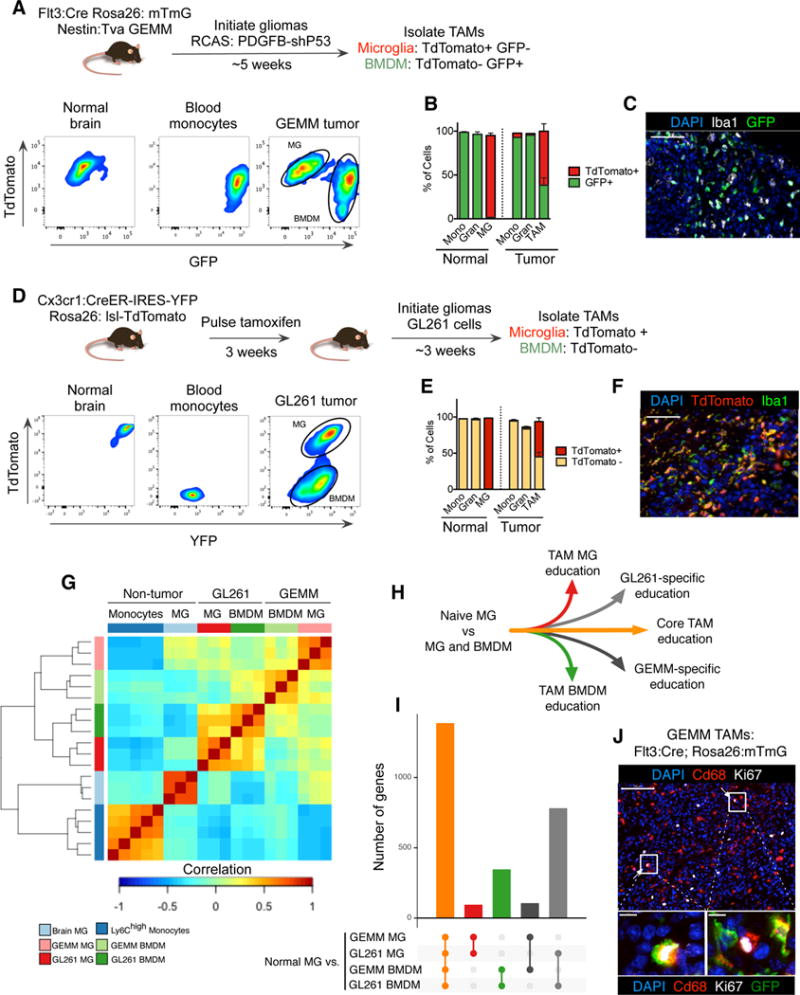
(A) Experimental scheme for the GEMM-shP53 model, see Supplemental Experimental Procedures for details. Representative flow cytometry panels for TdTomato and GFP are shown for Cd45+Cd11b+Ly6G−Ly6C− microglia (MG), Cd45+Cd11b+Ly6G−Ly6C+ monocytes, and Cd45+Cd11b+Ly6G−Ly6C−TAMs from GEMM-shP53 gliomas. (B) Quantitation of TdTomato+ and GFP+ monocytes (Mono) and granulocytes (Gran) in peripheral blood, MG in non-tumor bearing brain, and monocytes, granulocytes and TAMs in GEMM-shP53 gliomas as depicted in (A). Bars represent mean and s.e.m. n=3–5 for each group. (C) Representative immunofluorescence (IF) staining of Iba1 (white), GFP (green) and DAPI (blue) in a GEMM-shP53 tumor as depicted in (A). Scale bar: 50μm. Representative of n=5 tumors. (D) Experimental design for Cx3cr1 lineage tracing model, see methods for details. Monocytes, MG and TAMs were isolated as described in (A), and evaluated for TdTomato and YFP reporter expression. Representative of n=3 mice. (E) Flow cytometry quantitation of TdTomato+ and TdTomato− monocytes and granulocytes in peripheral blood, MG in non-tumor bearing brain, and monocytes, granulocytes and TAMs in GL261 gliomas as depicted in (D). Bars represent mean and s.e.m. n=3 for each group. (F) Representative IF staining for Iba1 (green), TdTomato (red) and DAPI (blue) in a GL261 tumor. Scale bar: 50μm. (G) Pairwise correlation matrix of normalized RNA-seq counts from monocytes (n=5), normal MG (n=3), and the four TAM populations from the different models: GEMM-shP53 TAM MG, GEMM-shP53 TAM BMDM, GL261 TAM MG, and GL261 TAM BMDM (n=3 for each group). (H) Diagram depicting different modules of TAM education compared to normal MG. (I) Differentially expressed genes between normal MG and the four TAM populations were tabulated. Barchart depicts the number of differentially expressed genes shared between the different groups, (J) Representative IF staining of Ki67+ TAM BMDM and TAM MG in the GEMM-shP53 model as depicted in (A). Ki67 (white), CD68 (red), DAPI (blue), GFP (green) (omitted from top panel). Scale bars: 100μm on upper panel, 10μm on lower panels. Representative of n=5 tumors.