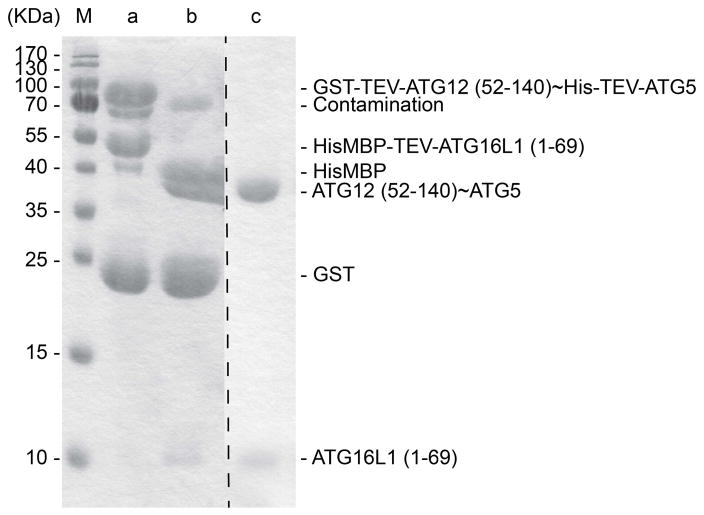
Fig. 6.
15% SDS-PAGE showing ATG12 (52–140)~ATG5-ATG16L1 (1–69) complex at different stages of purification. Lane M shows the molecular weight markers. Lane a shows elution from nickel-affinity chromatography, capturing His- and His-MBP tags on ATG5 and ATG16L1 (1–69), respectively. This is the second step in the purification, following an initial purification by glutathione affinity chromatography to capture GST-tag on ATG12. Lane b shows product of TEV cleavage reaction preformed during dialysis. Lane c shows final purified ATG12 (52–140)~ATG5-ATG16L1 (1–69) complex after subsequent cation ion exchange and gel filtration chromatography.

