Figure 3.
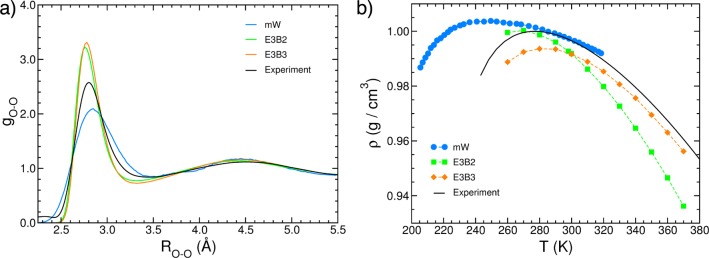
(a) Comparison between oxygen–oxygen radial distribution functions of liquid water at ambient conditions derived from X-ray diffraction measurements (black)108 and calculated from molecular dynamics simulations performed with the coarse-grained mW model (blue)100 and the empirical E3B models (green and orange).38,107 (b) Comparison between the experimental and calculated temperature dependence of the density of liquid water at ambient pressure. The experimental values (black) are from ref (304).

