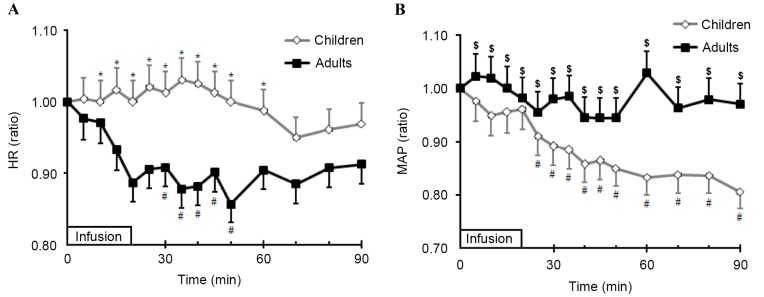
Figure 5.
Comparison of relative changes in (A) HR and (B) MAP during and after infusion of Ringer's solution between children and adults. Student's t-tests for comparisons between children and adults were performed during and after infusion of fluid. One-way analysis of variance was performed for comparison between MAP or HR baseline values and values following infusion of fluids. Data are expressed as the mean ± standard deviation. *P<0.01 vs. adults; $P<0.05 vs. children; #P<0.05 vs. baseline values for each group. HR, heart rate; MAP, mean arterial blood pressure.

