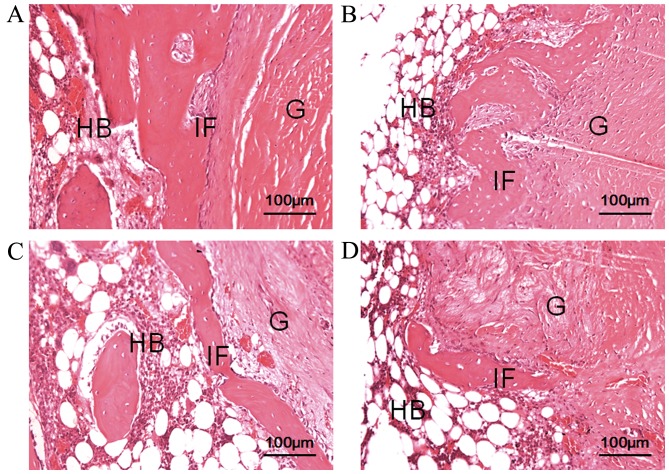
Figure 5.
Histological analysis of the tendon-bone interface at 6 and 12 weeks after surgery (hematoxylin & eosin staining). Images at 6 weeks in the (A) control and (B) PVP-I groups, and at 12 weeks in the (C) control and (D) PVP-I groups. Scale bar, 100 µm. HB, host bone; G, tendon graft; IF, interface; PVP-I, polyvinylpyrrolidone-iodine.

