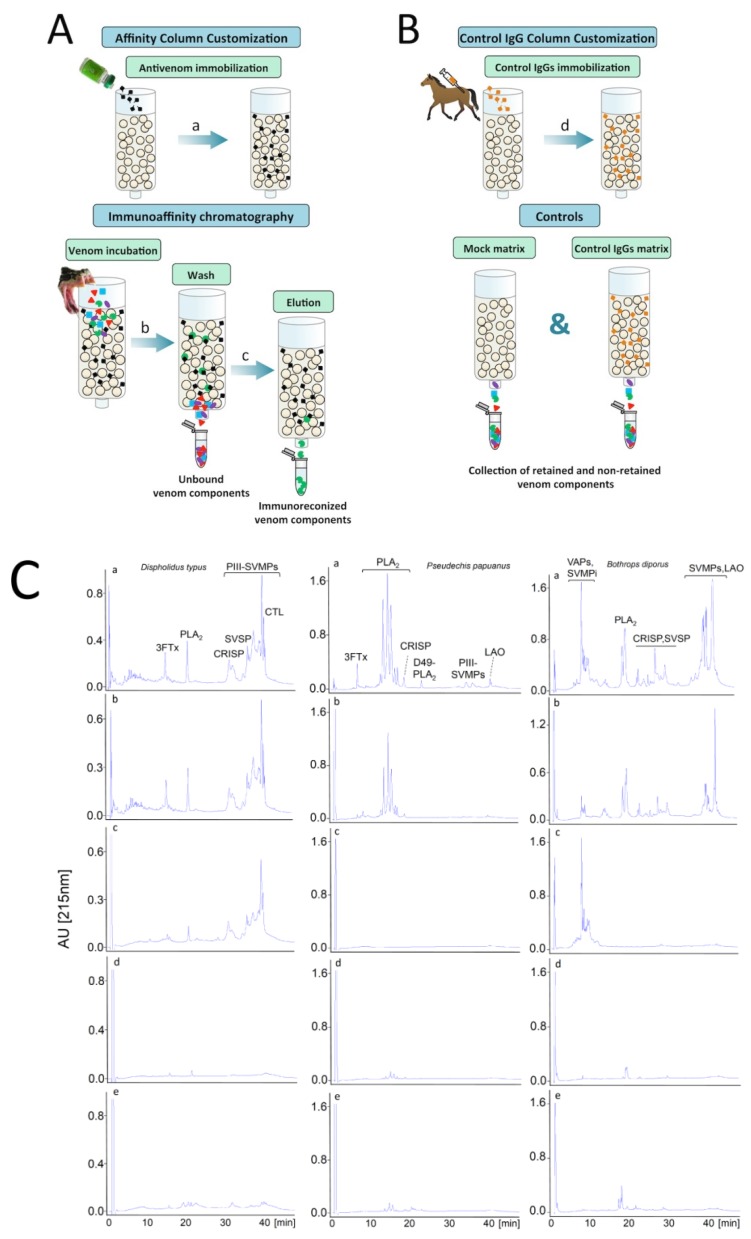
Figure 3.
Cartoon of the “second generation” antivenomics workflow [127]. Panels (A) and (B) illustrate, respectively, the generation of the immunoaffinity (a) and control antibody (d) columns, and the steps of the antivenomic protocol to assess which toxins show immunoreactivity towards the immobilized antivenom molecules (c) and which do not bind to the immunoaffinity column (b). Mock matrix and control IgG columns, run in parallel to the immunocapture experiment, serve as specificity controls. Panel (C) displays three immunoaffinity experiments using venoms of snakes from different families: antivenomic analysis of D. typus (Colubridae: Colubrinae) venom against CroFab™ antivenom (left) [134], antivenomic analysis of P. papuanus (Elapidae) venom against Australian antivenom (middle) [132], and antivenomic analysis of B. diporus (Viperidae: Crotalinae) venom against Butantan pentabothropic antivenom (right) [135]. Chromatograms labeled “a” display reference RP-HPLC separation of the venom proteins. Major protein classes identified in the different chromatographic fractions are highlighted (3FTx, three-finger toxin; PLA2, phospholipase A2; CRISP, cysteine-rich secretory protein; SVSP, snake venom serine proteinase; PIII-SVMP, snake venom metalloproteinase of class PIII; CTL, C-type lectin-like molecule; LAO, L-amino acid oxidase; VAP, vasoactive peptide; SVMPi, tripeptide inhibitor of SVMPs). Chromatograms “b” and “c” display, respectively, reverse-phase separations of the immunocaptured and the non-bound column fractions recovered from the immunoaffinity columns. Chromatograms “d” and “e” show, respectively, reverse-phase HPLC separations of the venom components recovered in the bound fractions of mock matrix and control IgG columns.

