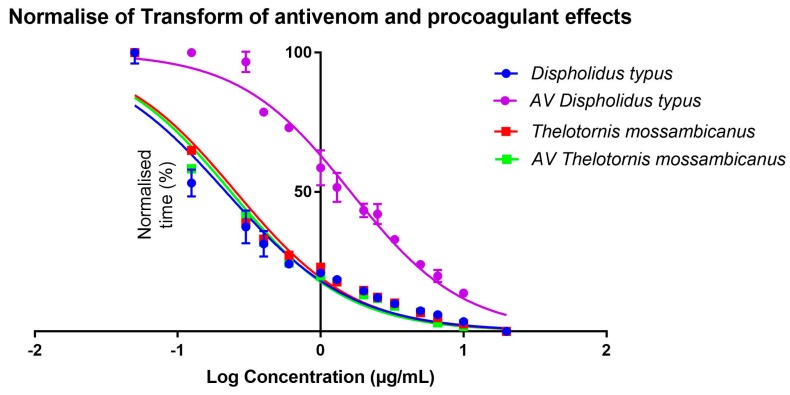
Figure 9.
Normalisation of transformed data; antivenom and procoagulant effects of D. typus and T. mossambicanus. D. typus clotting curve given in blue circles, AV D. typus = antivenom response curve given in purple circles, T. mossambicanus clotting curve given in red squares, AV T. mossambicanus = antivenom response curve given in green squares. X axis: log concentration, Y axis: Normalised time (%) (for sub data sets). Analysis performed in GraphPad PRISM 7.0. Values are averages of triplicates (single dilution measured three times), and standard deviation error bars are shown for each, although for most the error range is smaller than the line icon.

