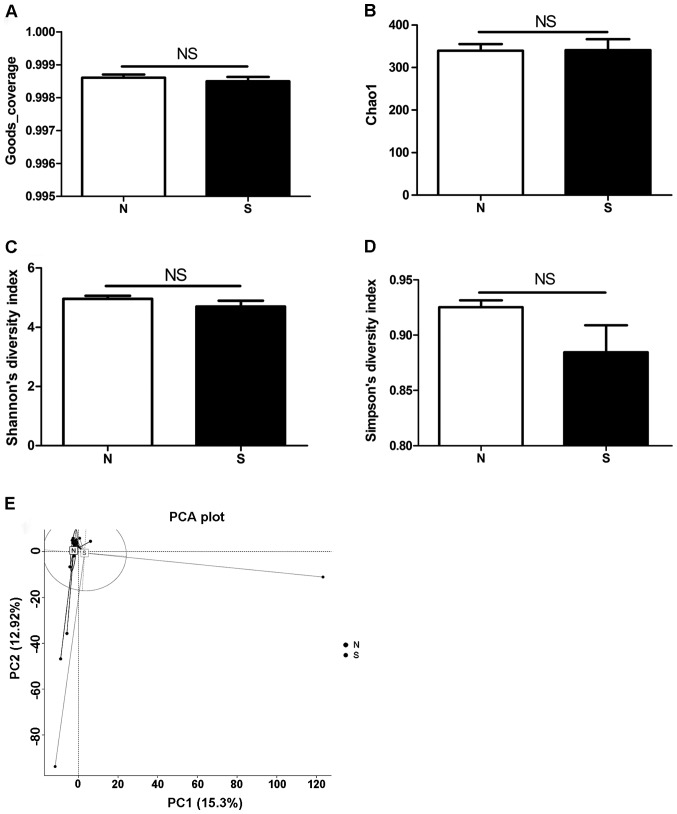
Figure 3.
Diversity of gastric microbiota. (A) Results showed that the Goods coverage was both more than 0.99 and no statistical significance between the two groups. (B) The Chao 1, (C and D) Shannon's and Simpson's diversity indices in atrophic gastritis were not statistically significant different to that in non-atrophic gastritis. The PCA results showed the microbiota from the N group tended to cluster together, whereas samples from S group were scattered in (E) the PCA plot. All the analysis of microbiota were performed as described in Materials and methods.

