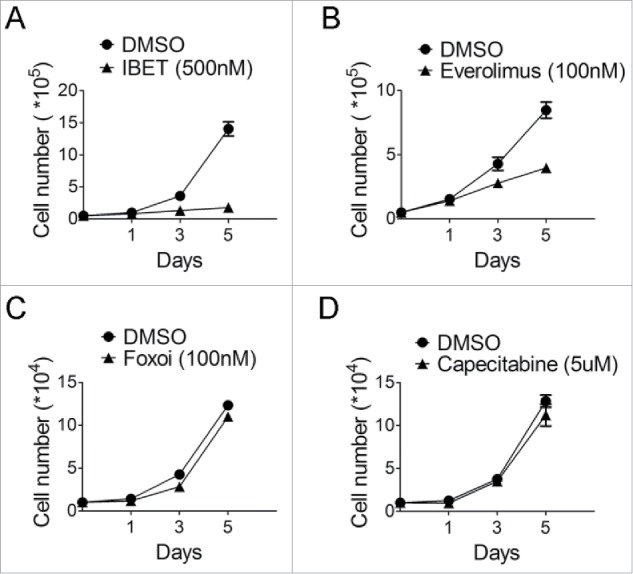
Figure 2.

The time course of treatment of BON cells with various drugs. (A) Cell counting following treatment of the BON cells with IBET (500nM) for the indicated time. (B) Cell counting following treatment of the BON cells with everolimus (100nM) for the indicated time. (C) Cell counting following treatment of the BON cells with Foxoi(100nM) for the indicated time. (D) Cell counting following treatment of the BON cells with capecitabine (5μM) for the indicated time.
