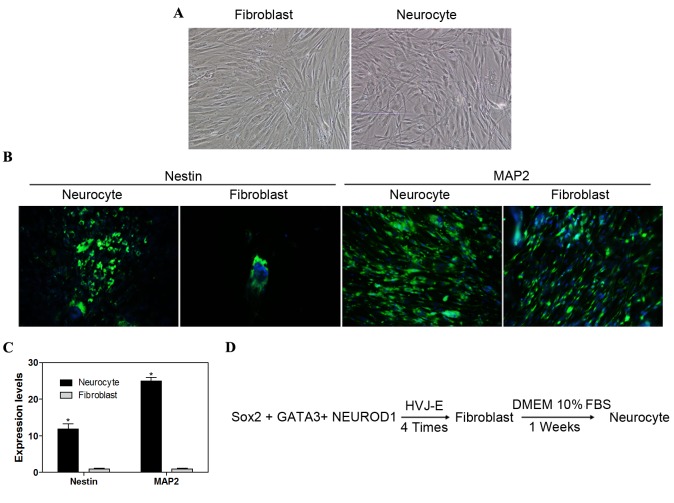
Figure 4.
Direct neurogenic reprogramming. (A) Induced neurocytes exhibited typical neuron morphology with soma, dendrites and axons (magnification, ×100). (B) Nestin and MAP2 markers were identified by immunofluorescence staining (magnification ×100). (C) Reverse transcription-quantitative polymerase chain reaction analysis of MAP2 and nestin expression levels in differentiated iPS cells. (D) Procedure of direct neurogenic reprogramming. Data are expressed as mean ± standard deviation (n=3 in each group). *P<0.05 vs. fibroblast control group. MAP2, microtubule-associated protein 2; iPS, induced pluripotent stem; Sox2, sex determining region Y-box 2; NEUROD1, neurogenic differentiation 1; HVJ-E, hemagglutinating virus of Japan envelope; DMEM, Dulbecco's modified Eagle medium; FBS, fetal bovine serum.

