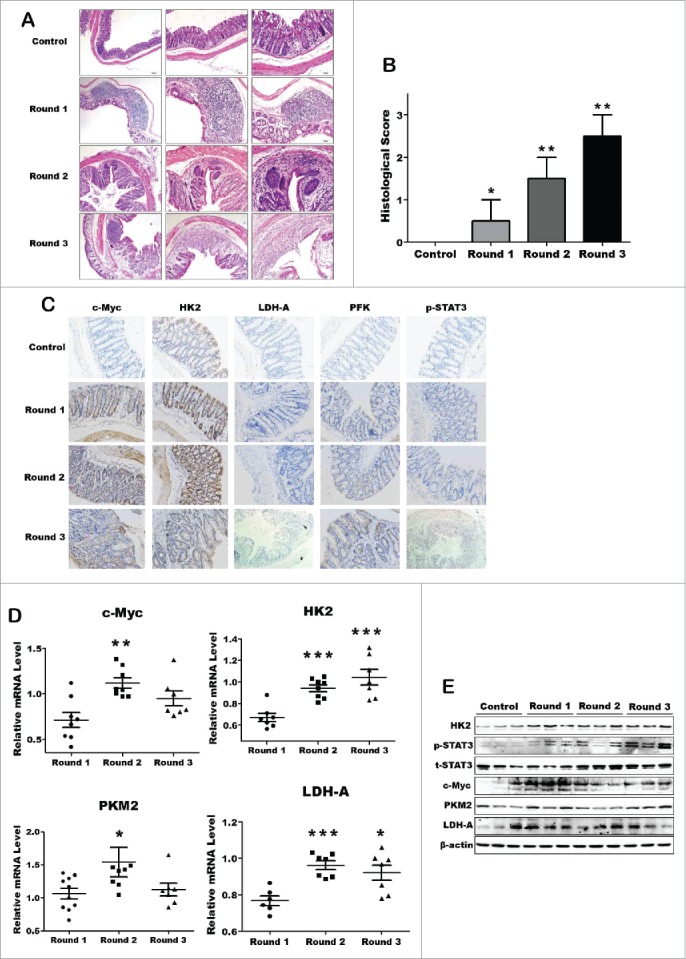
Figure 2.

The key metabolic enzymes expression significantly increased in DSS-induced chronic colitis model. (A) Representative H&E-stained colon sections (magnification *200). (B) Histology score. Values were expressed as means ± SD (n = 10). *p < 0.05, **p < 0.01, ***p < 0.001 vs. control group. (C) Inmmunohistochemical staining showing expression of the key enzymes in colon mucosa of each DSS-induced colitis groups and control group. (D and E) The mRNA and protein expression of the key enzymes of aerobic glycolysis.
