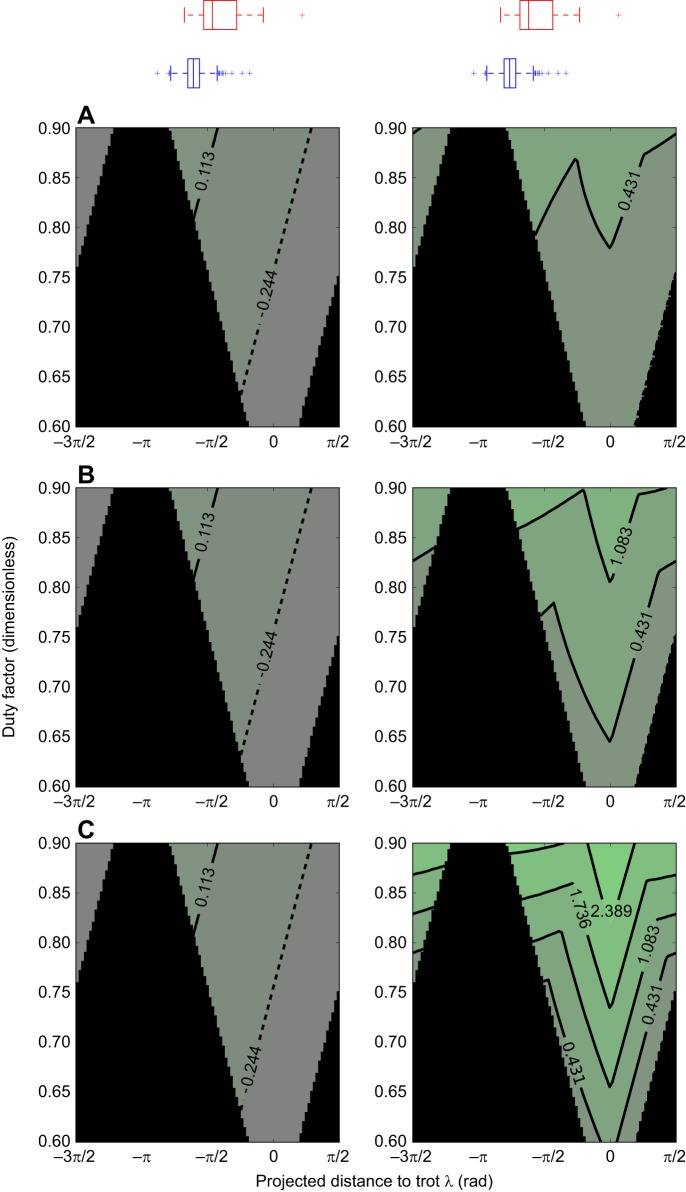
Fig. 3.
Contour plot of longitudinal quasi-static stability margins against projected distance to trot, λ, duty factor and fore-hind touch-down spatial separation a, in the neighbourhood of the stereotypical (single-foot in lateral sequence) walk. λ is varied on the x-axis, duty factor on the y-axis. Rows have different fore–hind touch-down spatial separation a, with (A) 0.5, (B) 1.0 and (C) 2.0. Lighter green is higher stability. The left panels display the minimum stability margin observed throughout a stride; the right panels display the average. The solid black region is where during the stride the quadruped has at least one period with no feet on the ground and the stability margin is undefined. Trot lies at zero on the x-axis, and the stereotypical (single-foot in lateral sequence) walk at –π/2. Irrespective of a and over the full range of duty factors, a shift towards trot is more desirable than away from trot. The box plots above the contour plots are of the observed λ, for all dogs (n=6; blue, even ground; red, uneven terrain). The gait on rough terrain shifts towards trot, where the longitudinal static stability margins are higher.

