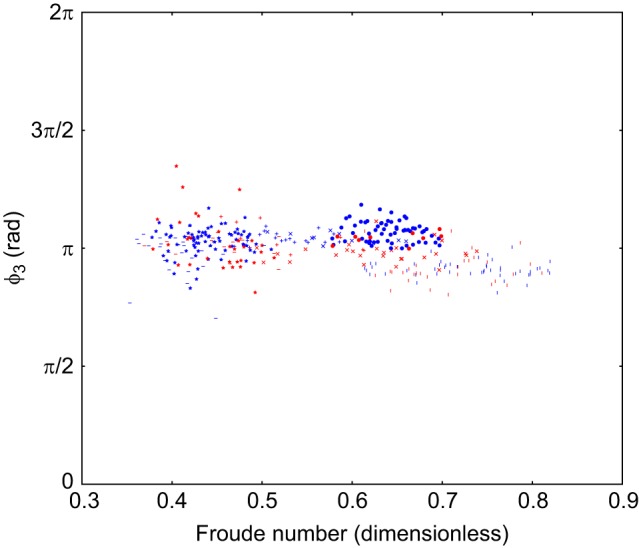
Fig. 8.

Scatter plot of ϕ3 against speed. This is the phase difference between hind-right and hind-left. Projection is in radians, the marker shape denotes dog (371 strides, 6 subjects, as in Table 1), the colour of the points indicates terrain (blue=flat, red=rough).
